What does demographic change mean for the future of housing?
The population of England – in line with many other European countries – is undergoing some significant changes that will have far-reaching implications for the future of housing.
In short, the population of England has grown significantly over recent years and we are likely to see a continuation of this trend in the future. But growth is going to be concentrated, both in terms of geography but also in terms of demography. This article looks at what demographic change is going to look like in England and it will ask what this means for housing.
The population of England is likely to grow by 9 million until 2039 – most of it is going to be in urban areas
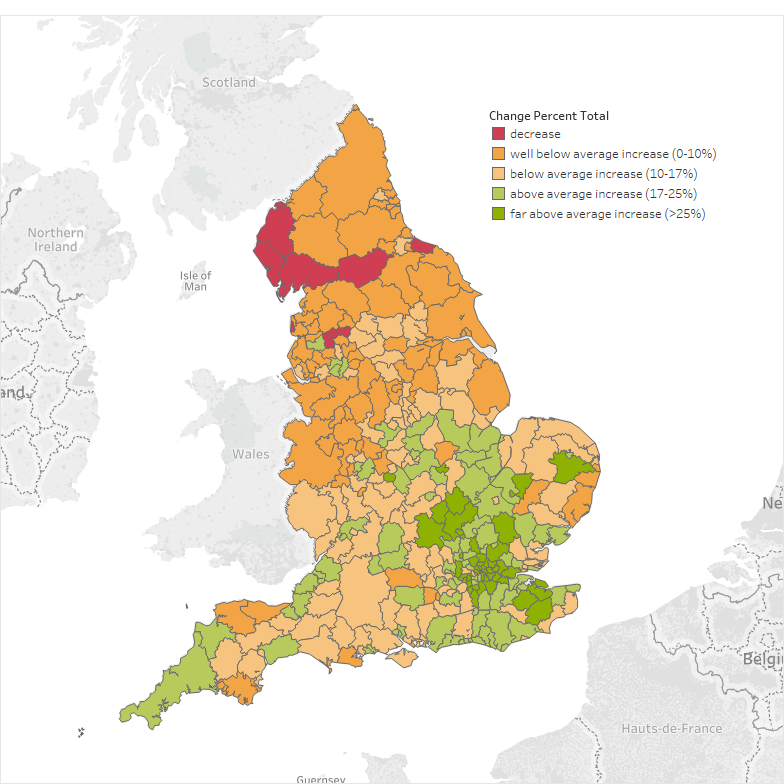
According to the latest population projections by the Office for National Statistics, between 2014 and 2039 the population of England is projected to grow by around 9 million people, which represents an increase of 17% or a rate of around 0.7% per year. While this may sound a lot, population growth is in line with many other European countries, such as Denmark (16%), Belgium (15%) or Ireland (17%). Importantly, within England population growth varies significantly, with the population in London (+29%) projected to grow more than four times as fast as the population in the North East (+7%). While all regions in England are expected to see an overall growth in their population there are some local authorities in the North West, the North East and Yorkshire and the Humber that are likely to see a decrease in their population.
Figure 1. Projected population change between 2014 to 2039, by local authority

Source: ONS Population projections (population of England)
How will demographic change look in your area? (click here for interactive map)
Looking at population from an urban/rural perspective, the projections show that population growth is not only disproportionately fast in London but in larger cities such as Birmingham or Manchester more generally, indicating a continuing trend of urbanisation. In fact, urban areas are projected to absorb 83% of total population growth, with the remaining 17% expected to occur in rural areas. While this trend of urbanisation has been underway for almost two decades now, it is noteworthy to point out that in the 1980s and 1990s, de-industrialisation caused around a third of all cities in the UK to see a decline of their population (Champion 2016: 131-137). The recent urban recovery and the disproportionate growth of the UK’s urban population has therefore also been described as a process of ‘re-urbanisation’.
Crucially, while population projections are important indicators for potential future housing need, overall figures do not say anything about the type of population growth and hence the type of housing that may be needed in the future. Population projections by age are a much better indicator in this regard.
The geography of an ageing society
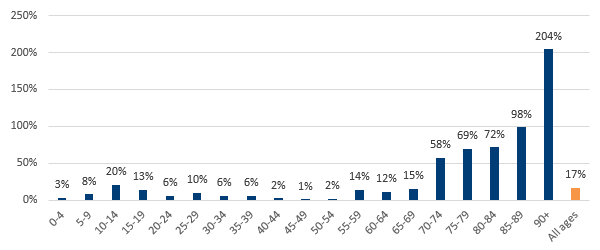
Not all age groups are expected to increase at the same pace. By far, the fastest increase is going to occur among people aged 70plus. More precisely, the older the age group the faster the rate of increase is expected to be. For example, while the age group 70 to 74 years is projected to grow by 58%, the proportion rises to 98% for 85 to 89 year olds. The number of those aged 90plus is projected to triple in size (+204%) from around half a million today to one and a half million in 2039. This demographic change will mean that the English population of pension age (65plus) will rise from 18% in 2014 to almost a quarter (24%) in 2039, a process that has been described as an ageing of society.
Figure 2. Population change in England: projected change by age group, 2014 to 2039

Source: ONS Population projections (population of England)
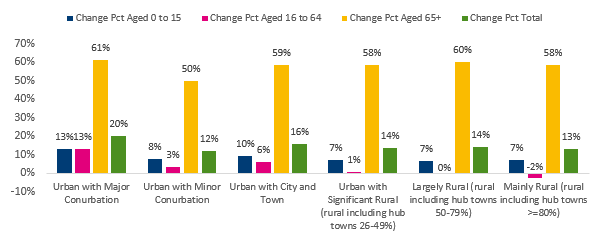
Crucially, while overall population growth is expected to be higher in urban areas compared to rural areas, the nature of this demographic change looks different too. Both urban and rural areas will see a disproportionate increase in their pension-age population, ranging from +61% in the most urban areas to +58% in the most rural areas. As such, the demographic shift towards an ageing society is both a rural and an urban phenomenon. However, due to the higher numbers (and proportions) of people of working age and of young persons (aged up to 15 years) expected to live in urban areas, this demographic shift is likely to be more age-balanced in urban areas. In contrast, rural areas will see a more significant shift in their demographic profile, with a more accelerated shift towards an ageing population.
Figure 3. Projected population change between 2014 and 2039 by urban/rural classification

Source: ONS population projections (population of England)
What does this mean for housing?
These demographic changes will create very different housing needs in different parts of the country. In a nutshell, economically thriving areas in London and the South East as well as other bigger urban areas are likely to be faced with a continuing and rising demand for housing across all age groups. Many people living or trying to move to these areas are already facing severe affordability problems and these pressures are likely to remain in a critical state. Providing affordable housing in central and well-connected urban locations will therefore be one of the key challenges in order to maintain social diversity and make sure that also people with lower incomes will be able to live there.
In contrast, rural areas are more likely to see a stronger rise in demand for housing by older people. It goes without saying that there is a huge social and economic difference in older age groups, such as in any other age group. Nonetheless, an ageing population will mean that a growing number of people will need suitable homes for older age. This includes both making the right adaptations in order to improve accessibility for existing homes but is also going to increase demand for well-suited and well-placed homes and neighbourhoods that help individuals to live independent and healthy lives.
References:
Chamption, T. (2016): Internal Migration and the Spatial Distribution of Population. In: Champion, T. and Falkingham, J., eds. (2016): Population Change in the United Kingdom. Rowman & Littlefield International. London, New York, pp. 125-142.


1468-0491/asset/society_affiliation_image.gif?v=1&s=859caf337f44d9bf73120debe8a7ad67751a0209)
